Capacity utilization is meaningful only when you can explain the capacity underneath it. For a packaging line, define the product mix, output unit and realistic time basis before dividing actual output by a capacity estimate.
Choose the capacity question
A manager may ask whether the installed line can support more demand, whether a scheduled shift met its plan or why the machine lost time while running. Those questions need different measures. Name the question first, then label the denominator so that another shift can reproduce it.
The Federal Reserve’s G.17 notes define industry utilization as an output index divided by a capacity index. Its capacity concept allows a realistic schedule and normal downtime. That is useful context for defining capacity, but its industry series does not set a target for one packaging line.
For an internal operating measure, state what you are counting. Accepted packs, total machine cycles and shipped cases are different quantities. If you use accepted packs, label the result as accepted-output utilization on the stated basis rather than presenting it as interchangeable with every utilization statistic.
Write the denominator record
Use a documented capacity basis for the relevant SKU or representative mix. Avoid copying a nameplate rate that was established on another product. Record who approved the assumption and when it must be reviewed.
| Denominator field | Entry required | Error it prevents |
|---|---|---|
| Process boundary | Named line or operation and output unit | Comparing a machine cycle with finished cases |
| Product mix | SKU, format or defined mix | Applying an easy-product rate to a difficult mix |
| Time basis | Calendar, scheduled or other explicitly defined period | Changing the denominator between shifts |
| Capacity assumption | Sustainable output for that basis, with supporting observation | Treating a short best run as repeatable capacity |
| Normal downtime treatment | What is included and excluded | Deducting the same loss twice |
| Actual output | Count, quality status and matching period | Mixing good output with total cycles |
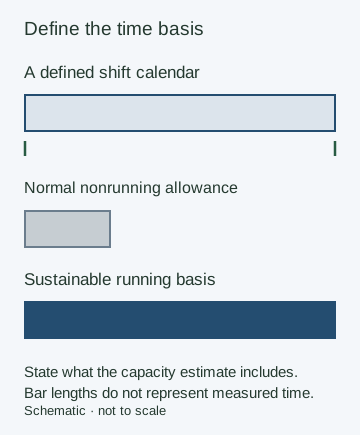
The time diagram shows a definition to document, not a prescribed downtime allowance. If the capacity estimate already allows for normal downtime, do not subtract it again from the comparison without explaining the change of basis.
Check the arithmetic with a transparent example
Suppose, purely for illustration, that your approved basis is 1,000 accepted packs per defined shift and the actual count for that same shift is 750 accepted packs. The internal accepted-output utilization is 750 ÷ 1,000 × 100 = 75%. These numbers are hypothetical and are not a machine benchmark.
If someone replaces the denominator with 1,250 packs because a different product once ran faster, the reported result becomes 60%. Nothing about the observed shift changed. That difference is a definition issue that must be resolved before evaluating performance.
Keep mixed products comparable
Different formats can consume different amounts of line time. Report them separately unless you have a documented conversion to a common basis. Summing unlike “units” can make a busy line appear underused simply because it ran a slower format.
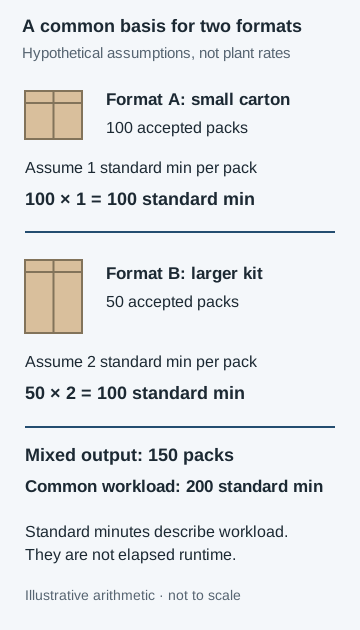
In the illustration, assume format A requires one standard minute per accepted pack and format B requires two. Then 100 A packs and 50 B packs each represent 100 standard minutes. The mixed output totals 150 packs and 200 standard minutes of workload. Those assumed standard minutes describe the common workload basis, not measured elapsed runtime. A real comparison needs documented, compatible standards and a capacity denominator expressed on the same basis; raw pack counts alone cannot supply it.
Do not use a high utilization target to justify building unnecessary inventory. Pair the measure with demand, accepted output and delivery requirements. A low result might reflect a demand gap, a scheduling choice or a production loss. Inspect the underlying record before selecting a remedy.
Likewise, a utilization percentage alone cannot separate availability, running performance and quality losses. Keep those investigations distinct. The automation observation sheet helps locate the cause; the cost model uses the chosen output basis to compare alternatives. The parent manufacturing automation guide connects the two.
When the loss points to mismatched station workloads, use production line balancing and packaging bottleneck diagnosis to compare station time with demand takt, distinguish blocking from slow work and assess accumulation before changing the line.
Methods and limits
This is a plant-record method with a hypothetical arithmetic example. It does not reproduce the Federal Reserve’s statistical estimation process and supplies no industry target. Keep the definition beside the percentage whenever it appears in a report. Checked October 2026.