A packaging bottleneck wastes production time by leaving upstream product waiting and downstream equipment starved while individual machines still appear fast. Production line balancing starts by comparing compatible measured station times with takt, then changing the work or losses that restrict accepted output.
Production line balancing aligns station workloads with the pace required by demand and identifies the bottleneck that limits the line. For packaging, first put filling, sealing, inspection and case packing on the same output basis; a case cycle cannot be compared directly with a single-pack cycle. Measure work and waiting separately, check which station cannot sustain the required pace, and investigate that constraint before adding equipment. A buffer can accommodate a temporary interruption, but it cannot make a persistently slower station meet demand.
| Input or item | Typical value or source | Why it matters |
|---|---|---|
| Required pace | Available time divided by demand; LEI takt definition | Establishes the comparison threshold |
| Station workload | Measured work for the stated SKU and output unit | Identifies an assignment that cannot fit the required pace |
| Transfer condition | Observed blocked, starved and stopped periods | Separates work imbalance from interruptions |
Separate measured station time from takt
Takt is the required completion interval; station time describes work that actually occurs. Compute the first from demand and measure the second under a stated product format and operating condition.
The Lean Enterprise Institute defines takt time as available production time divided by customer demand. Write the units beside the calculation:
Takt, T (seconds per required unit) = available production time, A (seconds per period) ÷ demand, D (required units per same period).
Define how breaks and other planned nonproduction periods affect available time. If a loss is already excluded from that basis, do not deduct it again without changing the definition. Demand and time must refer to the same period and product boundary.
LEI’s cycle-time definition uses actual measurement and distinguishes machine cycle time from operator cycle time. Observe their sequence where one operator serves several machines: automatic machine work can overlap manual work, so adding all durations can double-count elapsed time.
For a packaging survey, record the SKU, pack format, number of packs per case, parallel lanes, accepted output and observation period. Convert station output to the chosen finished-unit basis before comparing rates. A multilane machine’s mechanical cycle is not automatically its interval between finished packs.
Locate the bottleneck using work and waiting together
Treat the slowest comparable station as a candidate constraint, then check whether it is working, blocked, starved or stopped. A queue alone cannot distinguish a long task from a downstream interruption.
Use the following editorial observation table to connect a symptom to a verification step. The failure modes are possibilities to investigate, not diagnoses of an unseen line.
| Station or interface | What to observe on a common unit basis | Dominant Failure Mode & Prevention | What would support a change? |
|---|---|---|---|
| Product feed to filler | Refill interruptions, completed-unit interval and empty-feed periods | Starvation from inconsistent supply: verify replenishment and feed control | The filler is waiting for supply despite capacity to work faster |
| Sealing station | Work interval, acceptable seals and fault-related stops | Pack material or product at the sealing interface causes rejects or interruptions: investigate setup and contamination control | Lost output follows the fault; required seal conditions remain satisfied after correction |
| Inspection and reject transfer | Accepted count, reject-related interruptions and blocked discharge | Product-spacing or reject-transfer faults interrupt flow: verify the interface without weakening inspection | Accepted throughput improves while the inspection acceptance rule remains unchanged |
| Manual case packing | Work elements, replenishment, completed cases and downstream waiting | Uneven manual workload or missing materials: redistribute eligible tasks and stage approved supplies | A documented work sequence fits the required pace without transferring the delay elsewhere |
Compare observations for the same SKU and period. A station with a short working cycle can still restrict production through repeated stops. Conversely, a station waiting behind a full discharge conveyor is blocked; reducing its own working time may simply fill the queue sooner.
Compare each station with the demand threshold
Threshold rule: for a serial line in which each station handles one equivalent output unit per cycle, station time tᵢ > takt T means that station cannot sustain demand even before additional losses. Prioritize its work content or capacity constraint. If tᵢ ≤ T but accepted output still misses demand, investigate stops, rejects, starvation and blocking before buying speed.
This rule follows from the takt definition. Equality leaves no allowance for variation; a brief observation below takt does not demonstrate sustained capacity. For manual tasks, the LEI operator balance chart compares work elements against takt and supports redistribution. Preserve task precedence, quality checks and required process dwell when deciding what can move between stations.
Calculate balance against an explicitly named reference interval:
Balance efficiency E(C) = [Σtᵢ ÷ (n × C)] × 100%.
Balance delay B(C) = 100% − E(C).
Here, Σtᵢ is the nonoverlapping work content assigned across the stations, n is station count and C is the selected common cycle allowance or reference pitch. All times must share a unit and output basis. State whether C is a target pitch or the limiting station’s cycle; changing that denominator changes the result. If any assigned station load exceeds C, a favorable aggregate percentage cannot make that assignment feasible.
Check the formula with published packaging-study inputs
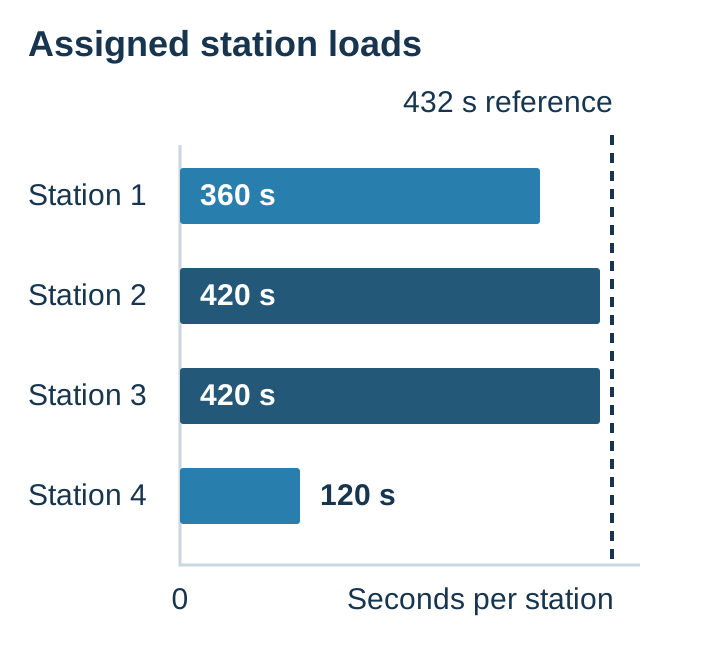
A published-data illustration avoids inventing station times. In their 2024 rice-processing and packaging study, Okereke, Isaac and Akaninwor list cumulative station loads of 360, 420, 420 and 120 seconds in Table 2, page 23. The conclusion on page 24 gives four stations, 1,320 seconds total work and a 432-second takt reference.
Worked example — reconstruction of those published inputs: E(432) = (360 + 420 + 420 + 120) ÷ (4 × 432) × 100 = 76.39%; B(432) = 100 − 76.39 = 23.61%.
This is assigned work divided by available station slots at the paper’s reference pitch. It is not a packaging-machine speed specification or a forecast for another plant. The study includes processing tasks, so its seconds must not be applied to a retail pouch, bottle or case cycle.
Stations 2 and 3 have the largest assigned loads in that table, yet each is below the stated reference pitch. That illustrates why the longest station and a demand shortfall are separate questions. The calculation alone does not include recurring stops, finished-pack quality or transfer behavior. Nor should balance efficiency be substituted for OEE or treated as a measured before-and-after improvement.
Use a buffer for temporary separation between stations
Consider accumulation when the observed interruption can be bridged without exceeding product-handling or residence constraints. The buffer also needs an achievable recovery path after the interruption.
Dorner’s accumulation page describes buffering equipment, including minimal-contact and zero-pressure options for delicate products. That establishes relevant handling choices; it does not establish a buffer capacity or throughput gain for this line.
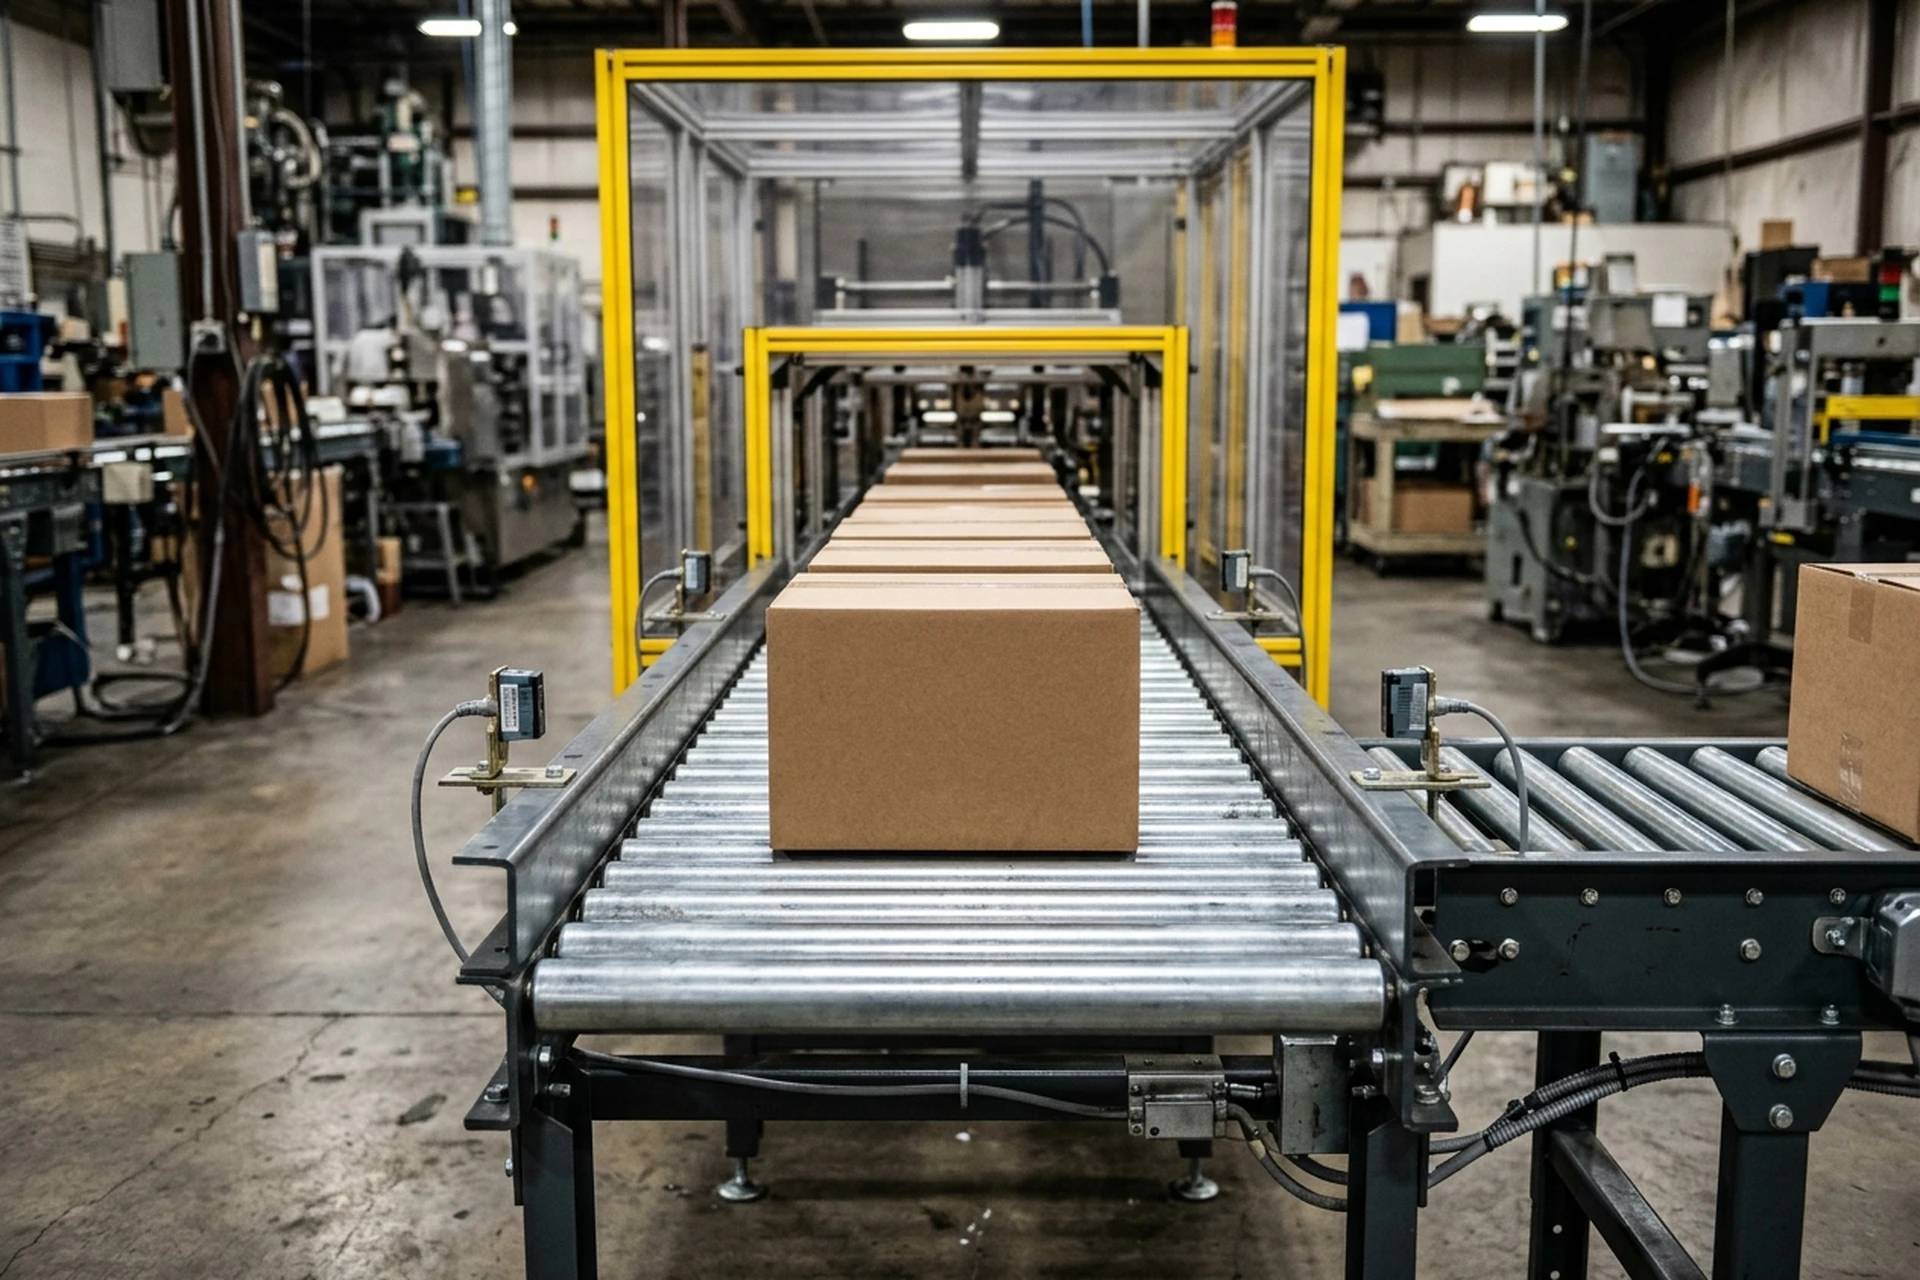
Record where product waits, how much accumulation is physically usable, the stop-duration history, product-contact restrictions and the upstream and downstream recovery rates. Check residence limits, traceability and acceptable pack condition with the responsible process owner. A long conveyor is not necessarily usable accumulation.
If arrivals persistently exceed departures, inventory continues to increase until storage is full. A buffer therefore buys time against an interruption; it does not remove an enduring rate deficit. Do not specify a number of packs or a reserve duration until the line’s actual event data and handling constraints support it.
Count hidden losses before accepting a rebalance
Accept a change when it improves the required accepted output on a matching time and product basis without unacceptable additional work or inventory. Equal-looking station bars are insufficient evidence.
Use the live capacity-utilization guide to keep the capacity denominator consistent. Alongside throughput, record extra material handling, replenishment labor, work in progress, damaged packaging, rework and restart losses. Moving an operator can shorten one station’s work while adding a delay to another task that was outside the original observation.
Retest the same SKU and boundary after a bounded change, recording both work intervals and interruption states. Preserve accepted-output criteria throughout. Use the parent manufacturing automation guide to connect the confirmed constraint with the wider capacity and investment decision.
Methods and sources
Definitions come from LEI; the worked calculation reconstructs a published rice-packaging study’s cumulative times at its stated reference pitch. It does not reuse the study’s OEE-to-balance comparison as a production gain. Buffer discussion combines a narrow OEM handling description with the physical requirement that sustained arrivals and departures must balance. Observation tables are editorial tools; actual cycle times, buffer capacity and performance improvements require line records. Updated October 2026.